
During the GAP 2019 transportation engineering conference, leading researchers from The University of Texas at El Paso (UTEP) provided a number of papers and presentations. One that drew considerable attention was “Development of a Mechanistic Approach to Quantify Pavement Damage Using Axle Load Spectra from South Texas Overload Corridors.” Here, we present an abbreviated version of the paper by Ali Morovatdar, Reza S. Ashtiani, Carlos Licon, and Cesar Tirado. Their insight into the impact of overloading roadways is very interesting, especially as it indicates that this new methodology confirms that axle load equivalency factors (ALEF) values are significantly higher than those yielded through the traditional Asphalt Institute ALEF method–which is commonly used by pavement design engineers. Severe overloading could damage the full system (extending through the base) beyond what standard maintenance can repair.
The full paper version of this article is available in the GAP 2019 conference proceedings (PDF). GAP was developed and managed by Geosynthetica.
1. INTRODUCTION
Texas has experienced a boom in the production of energy-related activities such as natural gas and crude oil since 2008. These energy development activities have created large volumes of traffic operations in the network that adversely impacted the transportation infrastructure systems such as pavements and bridges. Specifically, in the South Texas region, damaged local and county roads have been a major source of inconvenience for the local residents. Lack of accurate assessment of the problem coupled with unclear guidelines is among the many elements that contribute to the delay of the pavement maintenance and repair in several counties. The quantification of the energy development impacts on the highway network is the prelude to adopting proper rehabilitation strategies to meet the future growth of traffic in overload corridors. This can effectively protect the taxpayers’ money spent on transportation systems each year. Consequently, there is a pressing need to properly quantify the damages imparted by the energy-related vehicles in the affected network.
The main step in the quantification of the pavement damage induced by energy-related operations is by the determination of Axle Load Equivalency Factor (ALEF), defined as the quantification of the damage per pass to a pavement section relative to that of a standard 18-kip single axle. The ALEF values are primarily dependent on the pavement types, pavement layers, layer thicknesses and structural integrity of the pavement layers in the network. Current ALEFs are based on the AASHTO formulations with several simplifying assumptions for generalization across the nation. The major problem that pavement designers and other professionals face is that the analysis procedures rely on experimental information that was developed from field measurements in the late 1950s and early 1960s. Moreover, the Road Test was limited to one location and had limited traffic levels in comparison to the current traffic loading conditions. The relationships that were established from the AASHTO Road Test might be suitable for similar conditions under which the tests were conducted; however, the relationships were also extrapolated to conditions that the original tests did not account for. Therefore, considering the fact that each network has its own specific characteristics, it deems necessary to develop a new set of ALEFs that accounts for the site-specific traffic loading conditions as well as the pavement layer properties attributed to the overload corridors in the energy sector zones.
Pavement damage quantification has been previously documented in several studies. Batioja-Alvarez et al. (2018) developed a probabilistic approach to quantify the pavement damage induced by Over-Weight Over-Size (OW/OS) trucks, calculating Load Equivalency Factors (LEFs) based on two failure criteria (fatigue and rutting failure). The authors used 3-D Move software to evaluate pavement responses induced by the heavy axle load passages. Traffic loading conditions were assumed based on the previous permits issued.
The results showed that fatigue cracking-based LEFs attributed to the OW vehicles were higher than rutting-based LEFs. Based on the quantified damage imparted to the pavement structure, the researchers also calculated the pavement damage associated costs attributed to the passage of OW trucks. Banerjee et al. (2015) developed a methodology to determine load equivalency factors for various axle configurations and loads with a focus on oversize and overweight vehicles. They used a mechanistic-empirical approach to estimate the deterioration of the pavement structure. The authors provided the basis for developing axle-specific equivalency factors associated with the rutting and fatigue cracking. Sadeghi et al. (2007) evaluated the influence of overloading on the operational life of flexible pavements. The authors developed a deterioration model that is used for proposing a cost recovery method. They found that in most cases the asphalt layer tensile strain was the critical parameter. Wu et al. (2017) developed a GIS-based routing assistance tool to optimize OS/OW routes in Texas based on historical data, the expected heavy traffic level, and pavement condition. To achieve this, they developed pavement performance models based on a sigmoidal and basic power function under the combined characteristics of OS/OW vehicles, origin and destination, permitted routes, the frequency of routes, pavement condition, and climatic effects. The authors found that pavements under cold and dry environments performed better in the short term period than those subjected in hot and humid environments. The other reported finding was that at the early age of the road, higher OS/OW loading would bring a faster deterioration rate.
Other researchers in Texas have preferred the use of the Pavement Condition Score (PCS) as a primary performance index to evaluate pavement damage caused by OS/OW truck traffic (Robinson et al., 1996). Though not intended as a mechanistic indicator of the distress progression in pavements, researchers have preferred its use as a most accurate regression possible with the available traffic and pavement data. This score takes into consideration both the Distress Score (DS) and roughness (in terms of the International Roughness Index, IRI), defined by Texas Department of Transportation (TxDOT) in the PMIS database (Gharaibeh et al., 2012).
Chatti et al. (2009) conducted a study in Michigan to evaluate the effect of heavy multi-axle trucks with different axle configurations on induced pavement damage. This was done by determining the Axle Factors (AF) from laboratory and mechanistic analysis and then calculating Truck Factors (TF) using the AF and the AASHTO load equivalency factors. The analysis was performed considering the limited types of material properties and datasets. The permanent deformation parameters (ɑ, μ) in VESYS rutting model, were calculated using the previous SPS-1 experiment in the LTPP program. The rutting model was further calibrated based on only one standard axle. Ultimately, the analysis showed that the imparted rutting-based damage on pavement sections was mainly attributed to the passages of heavy trucks with multiple axles; however, these multiple axles were less damaging in fatigue compared to single axles. It was also found that the calculated damage equivalency factors, were significantly higher than those from AASHTO, especially for thinner pavements. This underscored the significance of the axle type and pavement layer properties effects on the pavement damage protocol.
MORE GEO: Implementing Pavement Preservation in Pavement Management Systems
In this study, a new mechanistic approach was developed to accurately calculate the damage equivalency factors tailored towards the site-specific material properties of the pavement layers and the unique features of the transportation systems, directly derived from the field data collection efforts in the overload corridors of South Texas.
2. BACKGROUND
The ALEF, for flexible pavements as defined by AASHTO, is defined as:

where:
Wtx = Number of -axle load repetitions after time t, and
Wt18 = Number of 18-kip axle load repetitions after time t, calculated from Equation 2,
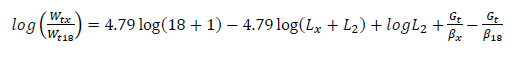
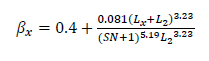
where Gt and βx are defined as:

where:
L2 = Load in kips on one single axle, one set on tandem axles and one set of tridem axles,
Lx = Axle code, 1 for single axle, 2 for tandem axle, and 3 for the tridem axle,
SN = Structural number,
Pt= Terminal Serviceability,
Gt = Function of terminal serviceability, and
β18 = Value of βx when Lx is equal to 18 kips and L2 is one.
As is evident in Equation 1, the ALEF for each axle load group is a function of the structural number (SN) which in turn is related to stiffness properties of layers, drainage conditions and the thickness of pavement layers in the network. For generalization purposes, Asphalt Institute (AI) assumed structural number (SN) as 5 and terminal serviceability (Pt) as 2.5 to develop tables of ALEFs that are widely used by the pavement design industry to characterize the damage imparted by ith-axle load group relative to the standard axle on the pavements (Huang, 1993).
There are several sources of inaccuracy and systematic errors present in such assumptions that resulted in proposing a different approach to calculate the LEFs for the determination of the relative damages based on the unique features of the energy section zones. The major shortcomings of using the AI load equivalency factors to quantify damage are as follows:
- The ALEF tables are developed for specified SN and terminal serviceability (Pt) based on equations developed and later modified in the AASHTO road test. Considering the fact that some of the pavements in the energy section zones have been subjected to heavy loads for several years and already show visible signs of distresses and deteriorations, assumption of SN = 5 will result in underestimation the damage in the system.
- The effect of terminal serviceability and structural number on the value of the ALEF in the AASHTO equation is erratic and not consistent with the theory. Super heavy wheel loads are expected to have significantly higher ALEF than unity to indicate more damage compared to the standard 18-kip axle; however, the AASHTO equations predict higher damage with lower SN values.
- SN is a function of the layer thicknesses, drainage conditions and the stiffness properties of the layers. This basically indicates that ALEF is not a single value and should be different based on the features of the pavement systems in the network. Considering the fact that the passage of an overweight truck over an un-surfaced gravel road will potentially induce more damage compared to the passage of same truck over a well-designed and well-maintained interstate highway, using the same ALEF for both cases will compromise the accuracy of damage analysis.
In addition to these limitations, issues such as general methodology for the calculations of ALEF using AASHTO, coupled with the change in the material properties and loading conditions since the last modification of AASHTO equations, are the compelling reasons that induced proposing a new mechanistic approach for the calculations of the modified ALEFs.
MORE GEO: Permanent and Resilient Deformation Behavior of Geogrid-Stabilized and Unstabilized Pavement Bases
3. NEW MECHANISTIC APPROACH FOR PAVEMENT DAMAGE QUANTIFICATION
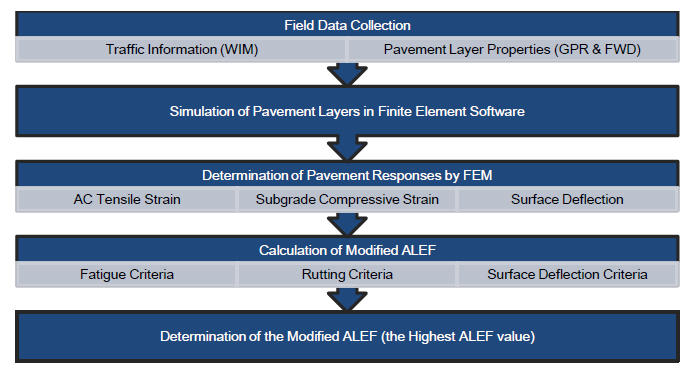
The proposed approach is based on the mechanistic determination of the axle load equivalency factors directly derived from the analysis of the different measures of failure criteria. This approach considers the site-specific traffic loading conditions, pavement layer configurations, as well as the stiffness properties of layers determined from the field data collection effort. Figure 1 indicates the procedure for the determination of the modified ALEF values. Initially, traffic information collected by WIM devices, as well as the site-specific pavement structures and layer properties determined after analysis of GPR and FWD field test results, were incorporated into the finite element analysis. Subsequently, the pavement responses including tensile strain at the bottom of Asphalt Concrete (AC), compressive strain at the top of subgrade layer, and surface deflection were obtained to calculate the three measures of axle load equivalency factors based on the three proposed failure criteria (fatigue, rutting, and surface deflection criteria). Ultimately, the highest ALEF value was chosen as the modified ALEF value tailored towards the site-specific conditions of the overload corridors in the network. Detailed information associated with the field data collection, finite element modeling and the related equations for calculating the modified Axle Load Equivalency Factors is provided in the subsequent sections.
3.1 Field Data Collection
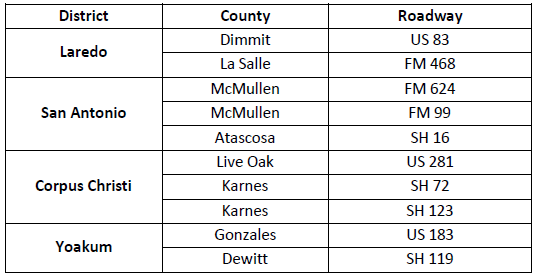
Data collection procedure was established to obtain the information associated with the traffic loading conditions and site-specific material properties (thickness and layer modulus) utilizing the GPR and FWD nondestructive tests. This information was collected for ten representative sites in the Eagle Ford Shale region of South Texas, their locations are listed in Table 1.
3.1.1 Traffic Loading Information
Proper characterization of the traffic operations in the affected overload corridors is of paramount importance for accurate quantification of the damage. The most favorable approach, as adopted in the new Mechanistic-Empirical Pavement Design Guide (MEPDG), is the concept of the Axle Load Spectra. In this approach, the performance of the pavement is tied to the traffic distributions of different class vehicles, unlike the traditional Equivalent Single Axle Load (ESAL) concept. To develop the Axle Load Spectra database the authors collected the necessary traffic information by deploying portable Weigh-In-Motion (WIM) devices across ten representative sites in heavily trafficked highways used by the oil and gas industry. The Axle Load Spectra database contained extensive information regarding:
- Truck traffic distributions
- Gross vehicle weights (GVW)
- Axle weights – Steering, Single, Tandem, Tridem, Quad
- Frequency of vehicle class in the highway network
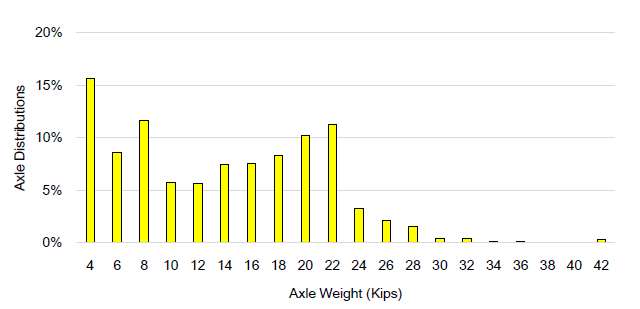
The corresponding traffic information such as axle weight, axle type, GVW and vehicle classification, derived from the Axle Load Spectra, were incorporated into the FE simulation. This information coupled with the axle configurations, obtained from the data recorded by the portable WIM devices were instrumental for the determination of the new modified load equivalency factors for South Texas overload corridors. Figure 2 illustrates the single axle load distributions for US 281, which is as an extremely trafficked highway in the Corpus Christi District.
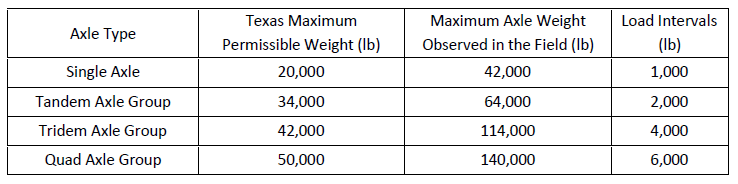
In this study, using the finite element analysis, OW axle loads were simulated since these heavy loads are extremely destructive to the pavement structure. Table 2 presents the overweight axle ranges considered in the numerical modeling. It also indicates the Texas permissible weight limits for different axle types. Axle weights heavier than these values are essentially considered overweight (OW) axles. Additionally, it illustrates the maximum axle weight recorded from the field data for different axle types and the load intervals defined in the finite element simulation procedure of the OW axles.
3.1.2 Calculation of Tire Pressure and Tire Footprint
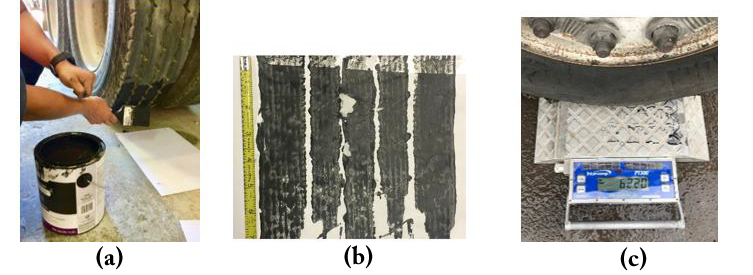
Due to the fact that the tire pressure has a significant impact on the pavement responses, the authors were motivated to conduct some experimental investigations in the field to calculate the actual tire pressure, instead of assuming a typical value. For this purpose, using Class 6 and Class 9 vehicles provided by the TxDOT, truck axles were weighed by static scales while their respective tire footprints were measured from prints of painted tires, as shown in Figure 3. Based on the observed measurements, a tire pressure of 120 psi was selected as representative for simulation purposes.
3.1.3 Nondestructive Testing
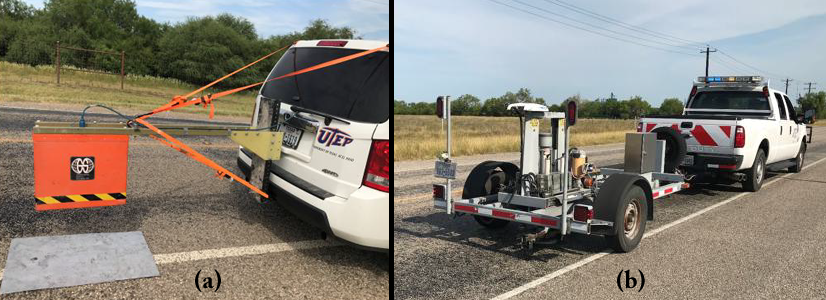
The authors also conducted the GPR and FWD test, as shown in Figure 4, to obtain site-specific material properties of the representative highways. Accurate layer thicknesses, layer configurations, and back-calculated layer moduli were incorporated in the FE models for selected pavement sections in the overload corridors. Pavement layers properties associated with all ten representative sites are provided in Ashtiani et al. (2019).
3.2 Finite Element Modeling
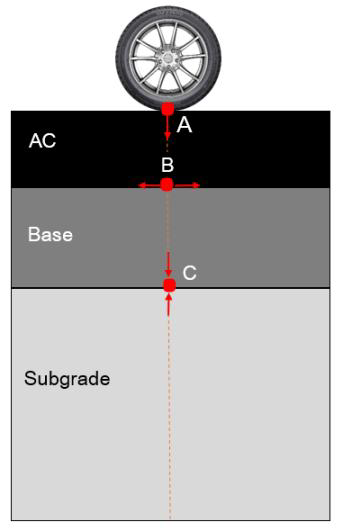
Different pavement layers consisting of surface layer, base and subgrade were simulated in the ABAQUS program as is presented in Figure 5. Based on the nondestructive test results, specific structural properties of the pavement layers such as the layer modulus and the layer configuration were assigned for each representative roadway in the finite element model. In terms of the meshing, a refined mesh was used to better address the critical pavement responses, at points directly located under the wheel path. However, to expedite the computation time and reduce the output files size, a coarser mesh in the regions far from the loading areas was used. Therefore, as shown in Figure 5, three-dimensional continuum elements C3D8 (eight-node linear brick) with finer meshing size and C3D6 (six-node linear triangular prism) with coarser meshing size, were assigned to the loading area elements and the other elements, respectively. In addition, a transition area was defined between fine and coarse mesh areas for gradual change of element size to ensure improved accuracy. Figure 6 also illustrates the locations where critical responses are obtained from the finite element modeling: Surface deflection at Point A, tensile strain at bottom of the AC layer (Point B) and compressive strain at top of the subgrade (Point C).

3.3 Modified Axle Load Equivalency Factors
The following three different classifications of axle load equivalency factors are used for accurate characterization of the damages imparted by energy-related operations in the network based on the finite element analysis:
- ALEF based on fatigue failure criterion: In the AI approach, the tensile strain at the bottom of the asphalt layer was selected as the critical response that controls the fatigue performance of the flexible pavements as shown in Equation 5:
![]()
Where the Nf is the allowable number of load applications to fatigue failure, εt is the tensile strain at the bottom of the asphalt layer, EAC is the modulus of the asphalt layer and f-values are the model parameters.
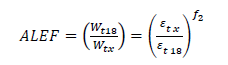
The equivalent axle load factor for axle load group x compared to standard 18-kip axle based on the fatigue criteria can be calculated from Equation 6 as:
ALEF based on rutting criterion: The AI rutting failure model assumes that the asphalt layer and the base layer will not experience any permanent deformation; therefore, all rutting is associated to subgrade permanent deformation (Bahia, 2000). Hence, the compressive strain εc at the top of the subgrade is assumed to be the controlling factor for the determination of the rutting performance of the flexible pavements. Equation 7 defines the rutting performance as:
![]()
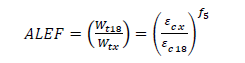
Where Nf is the allowable number of load applications to rutting failure. The axle load factor based on the rutting criterion can be calculated from Equation 8 as:
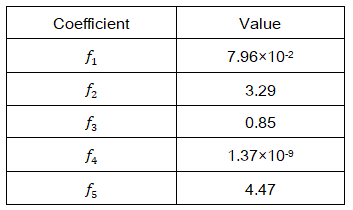
Coefficients f1 through f5 were input to the distress model equations similar to AI values, as shown in Table 3.
ALEF based on the surface deflection: The AI rutting failure criterion assumed that the asphalt and base layer remains intact during the service life of the pavement, and all the deformation is due to subgrade rutting. This is often not true, as there will be rutting in the asphalt and base layers during the service life of flexible pavements. Therefore, it deems necessary to consider an additional measure to calculate the axle load equivalency for pavement sections. To achieve this objective, the Finite Element method was used to calculate the surface deflection that represents the combined deformation of all layers. This information was used to develop a new measure of an axle load equivalency factor based on surface deflection criteria for different axle loads as shown in Equations 9 through 11:
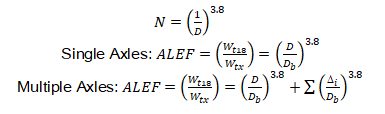
where, D is the surface deflection, D / Db is the ratio of pavement surface deflections caused by a single axle load to those recorded under the standard 18,000-lb single axle load (Db). Furthermore, is the difference in magnitude between the maximum deflection recorded under each succeeding axle and the minimum residual deflection preceding the axle (Kawa et al., 1998).
4. FE NUMERICAL SIMULATION RESULTS AND ANALYSIS
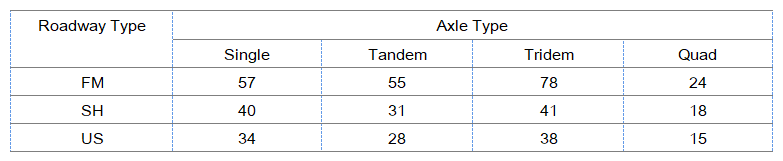
Finite element analysis was conducted to properly quantify the damage imparted on the overload corridors by evaluating the influence of site-specific roadway properties on the ALEF values. The modified ALEFs values of the three roadway types in the network were contrasted with each other for comparison purposes in this research effort as shown in Figure 7. The results showed that FM roadways with the weakest layer configurations had the highest damage factors among the three roadway types. Conversely, SH and especially US roadways with more robust layer configurations (medium thickness or thick asphalt layer as well as a stiffer base layer) had the lowest axle load equivalency factors. This underscores the fact that overlooking the influence of pavement layer configurations can potentially incur systematic errors for the pavement damage analysis of the overload corridors.
In order to clarify the significance of the site-specific characterizations, modified ALEF values were also compared with the traditional Asphalt Institute ALEFs as depicted in Figure 7. It was observed that traditional Asphalt Institute approach presents lower ALEF values than the proposed mechanistic approach. As indicated in Table 4, modified ALEF values on average could be up to 78%, 41%, and 38 % higher than traditional Asphalt Institute ALEF values in FM, SH and US roadways, respectively. Hence, it should be acknowledged that the traditional AI method underestimates the damage imparted on the different pavement types since it is not capable to evaluate the effect of site-specific properties on the ALEF values.
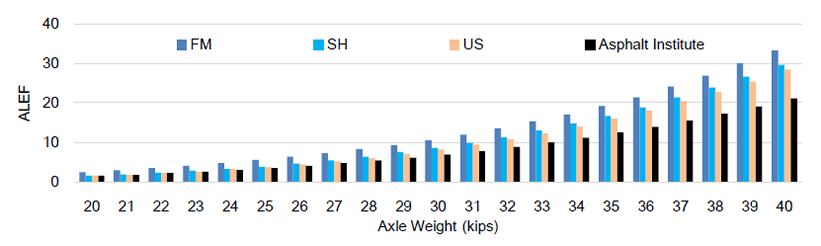


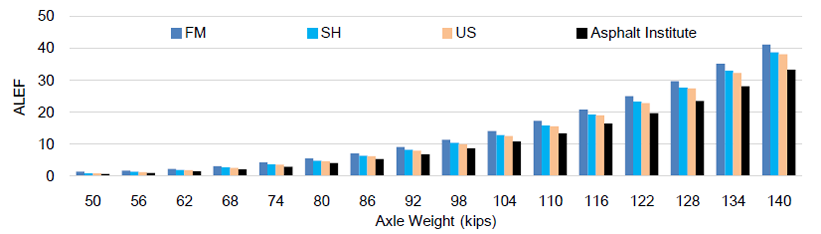
Figure 7. ALEF Values for Different Roadways in the Network and Different Axle Types a) Single Axle, b) Dual Axle, c) Tridem Axle, and d) Quad Axle.
5. SUMMARY AND CONCLUSIONS
The proposed mechanistic approach provides a useful and methodologically sound approach to properly quantify pavement damages associated with overweight vehicles in energy developing zones of South Texas. The major findings in terms of the damage factors in the selected roadways in the network are summarized as follows:
- The proposed mechanistic approach confirms that the modified ALEF values are significantly higher than the traditional Asphalt Institute axle load equivalency factors, commonly used by the pavement design engineers. In other words, conventional AI method underestimates the damage, since it is not capable to assess the ALEF values tailored towards the site-specific characteristics.
- The detrimental effect of traffic loads is higher for pavements with lower structural capacity. This is as expected, because heavy axle loads are more destructive to less robust pavement profiles such as FM roads than in US roadways. In the studied sections, FM roadways have the highest ALEFs, followed by SH and ultimately US roadways.
- Considering the fact that the pavement profile, mixture design, and environmental factors greatly influence the mechanistic damage equivalency factors in overload corridors, it is imperative to cluster and differentiate between different types of roadways, such as FM, SH and US roadways, to better represent the damages imparted on roadways due to overweight truck operations.
- The numerical simulations of 10 representative pavement sections in this study confirmed that the Tridem and Quad axles have lower damage factors per tonnage compared to single and tandem axles. This is primarily attributed to the distribution of axle loads over multiple wheel arrangements.
6. ACKNOWLEDGMENTS
The authors thank TxDOT for their financial support and the Maintenance Division of San Antonio, Corpus Christi, Yoakum and Laredo Districts for their collaboration with the research team to collect data.
7. REFERENCES
Ashtiani, R. S., Morovatdar, A., Licon, C., Tirado, C., Gonzales, J., & Rocha, S. (2019). Characterization and Quantification of Traffic Load Spectra in Texas Overweight Corridors and Energy Sector Zones (No. FHWA/TX-19/0-6965-1).
Bahia, H. U. (2000). “Layer coefficients for new and reprocessed asphaltic mixes”. Wisconsin Department of Transportation, Division of Transportation Infrastructure Development, Technology Advancement Unit.
Banerjee, A. and Prozzi, J. A. (2015). “Practical Approach for Determining Permit Fees for Overweight Trucks”, Transportation Research Record: Journal of the Transportation Research Board, 2478, 93–102.
Batioja-Alvarez, D. D., Kazemi, S. F., Hajj, E. Y., Siddharthan, R. V., & Hand, A. J. (2018). “Probabilistic Mechanistic-Based Pavement Damage Costs for Multitrip Overweight Vehicles”. Journal of Transportation Engineering, Part B: Pavements, 144(2), 04018004.
Chatti, K., Manik, A., Salama, H., Brake, N., Haider, S. W., Mohtar, C. E., & Lee, H. S. (2009). “Effect of Michigan multi-axle trucks on pavement distress and profile: Executive Summary (No. RC-1504). Michigan DOT.
Gharaibeh, N., Freeman, T., Saliminejad, S., Wimsatt, A., Chang-Albitres, C., Nazarian, S., Abdallah, I., Weissmann, J., Weissmann, A. J., Papagiannakis, A.T., and Gurganus, C. (2012). “Evaluation and Development of Pavement Scores, Performance Models and Needs Estimates for the TXDOT Pavement Management Information System-Final Report,” Report FHWA/TX-12/0-6386-3, Texas A&M Transportation Institute, College Station, TX.
Huang, Y. H. (1993). Pavement analysis and design (Second Edition). Pearson Education, Inc., New Jersey.
Kawa, I., Zhang, Z., & Hudson, W. R. (1998). “Evaluation of the AASHTO 18-kip load equivalency concept (No. FHWA/TX-05/0-1713-1)”. Center for Transportation Research, Bureau of Engineering Research, University of Texas at Austin.
Robinson, C., Beg, M., Dossey, T., and Hudson, W. (1996). “Distress Prediction Models for Rigid Pavements for Texas Pavement Management Information System.” Transportation Research Record: Journal of the Transportation Research Board, (1524), 145-151.
Sadeghi, J.M., and Fathali, M. (2007). “Deterioration Analysis of Flexible Pavements under Overweight Vehicles.” Journal of Transportation Engineering, ASCE, 133(11), 625-633.
Wu, D., Yuan, C., and Liu, H. (2017). “A Risk-based Optimization for Pavement Preventative Maintenance with Probabilistic LCCA: A Chinese Case,” International Journal of Pavement Engineering, 18, 11–25.


