By John D. Herrmann; Bruce A. Lacina, P.E.; and Monte Madsen – Oil and gas producers have uncovered many challenges when constructing well pads and access roads. Drill rigs have to set up in optimal locations related to where the shale oil and gas reserves are located, anywhere from 1,524 m (5,000 ft) to over 3,048 m (10,000 ft) below the surface. Energy producers must work with land owners to minimize disturbances to the land owner’s property. Poor subgrade conditions must be overcome, not bypassed in lieu of more ideal surface conditions for locating well pads.
Subgrade improvement may include several millimeters of aggregate, chemical stabilization or the use of geosynthetics. Geosynthetics allow energy producers to either reduce the initial aggregate requirements or eliminate maintenance of the well pad and access road.
Here, we look at an exemplary case in which laboratory and full-scale test data was used to evaluate the performance of an innovative high-strength geosynthetic in well pad construction. Detailed cost savings associated with the elimination of additional aggregate requirements are shown, along with an assessment of the environmental benefit in this strategy.
WELL PAD CONSTRUCTION BACKGROUND
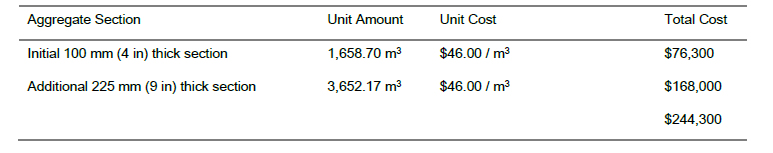
The Williston Basin area of North Dakota experienced up to 2,921 mm (115 in) of snowfall during the winter of 2010/2011. Following the spring thaw in 2011, Whiting Petroleum Corporation experienced numerous site challenges on their existing oil well pads and access roads. Severe rutting required substantial investment in additional aggregate to fill in ruts and stabilize well pads and access roads. On average, an additional 200 truckloads of aggregate were required to stabilize a typical well pad in addition to the original 100 mm (4 in) depth of aggregate originally installed per site. This resulted in a standard well pad requiring 3,652 m3 (4,800 yd3) of additional aggregate. Although aggregate costs are variable depending on distance from quarry to well pad, Whiting estimated aggregate at $46.00 per m3 ($35.00 per yd3) delivered, spread and compacted. Total aggregate cost for well maintenance averaged $168,000 per well pad, in addition to the original aggregate installed for $76,300.
In October of 2011, Whiting Petroleum Corporation began searching for more reliable means of stabilizing well pad and access road sites in the Williston Basin of North Dakota and Montana. Soil conditions, especially in areas north of the Missouri River, required more than traditional subgrade improvement solutions. TenCate Geosynthetics offered several geosynthetic solutions, ranging from traditional slit tape geotextiles, nonwoven geotextiles and extruded biaxial geogrids to a new innovative high strength woven geotextile, Mirafi® RS580i (hereafter referred to as GTXw). After reviewing much of the research and testing documented below, Whiting decided to test this new high strength geosynthetic on three well pad locations.
GEOSYNTHETIC RESEARCH
Using geosynthetics to improve the performance of aggregate surfaces and in stabilization applications has been done in the United States since the 1970’s. Unlike today’s design methods, most of the benefit from the geosynthetic was attributed primarily to tensile membrane support. The tensile membrane support function relies mainly on the presence of a geosynthetic in the cross section. The geosynthetic design tools created during this time reflected these concepts (e.g., Heukelom and Klomp 1962, Barenberg, et. al. 1975, Steward, et. al. 1977, Giroud and Noiray 1981).
SEE ALSO: Geocellular Stabilization for Oil and Gas Access Roads
The industry has realized through continuous product development that newer geosynthetics with integrated mechanical properties can provide a measureable benefit over earlier geosynthetics. There are currently many more types and strengths of roadway stabilization geosynthetics than were available in the 1970s. Modern design theories are able to incorporate the use of these new geosynthetics when they have been properly calibrated to the performance of the material (Giroud and Han 2012).
Early geosynthetics included 136 g/m2 and 271 g/m2 (4 & 8 oz/yd2) nonwovens and 890 N and 1.33 kN (200 & 300 lb) slit tape wovens. Research into the functions and behaviors of geosynthetics in roadway applications (Christopher and Lacina 2008) has led to the development of TenCate’s current GTXw high strength woven geotextile, offering integrated functions of layer separation, reinforcement strength, filtration and soil-aggregate interaction.
Geosynthetic Laboratory Testing
Laboratory testing has been performed over the years on geosynthetics to determine their relative performance and behaviors in different soil and gravel fills. Small-scale laboratory testing includes cyclic and monotonic pullout interaction, direct shear interaction, and filtration capacity. Large-scale laboratory testing includes the application of simulated wheel loads from truck traffic to compare, refine and develop reinforcement/stabilization geosynthetics. An example of the relative performance of different geosynthetics as a function of surface rutting in large-scale big box cyclic load testing is shown in Figure 1.
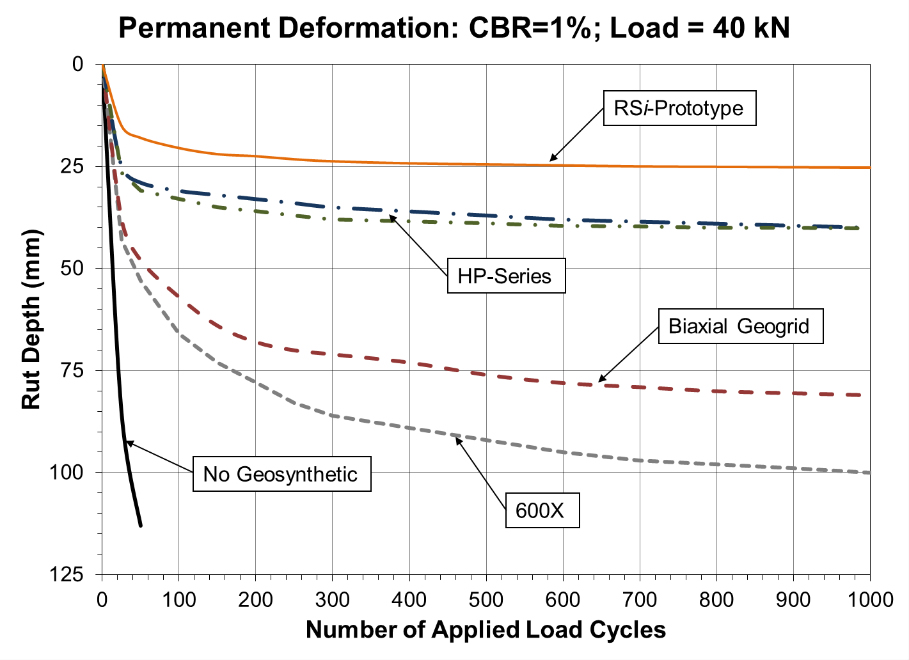
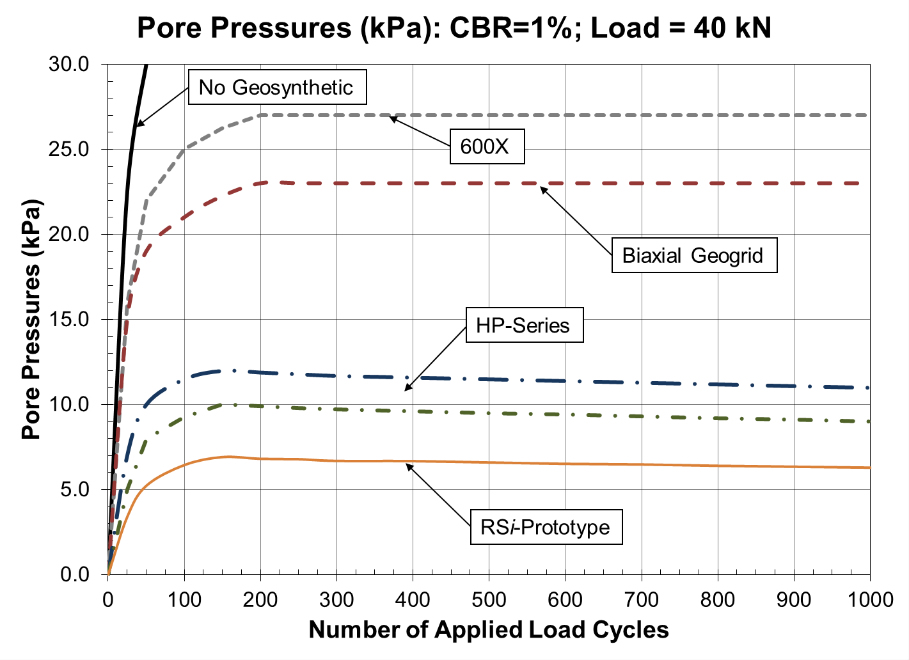
Test sections were constructed in a 2 m X 2 m (6.5 X 6.5 ft) X 1.5 m (5 ft) deep test box. A 300 mm (12 in) diameter steel plate placed on a rubber pad was used to simulate wheel loads that provided a uniform contact pressure on the test section surface. The applied loads and load frequency simulated a 40 kN (9 kip) wheel load or 80 kN (18 kip) axle load. Another significant role geosynthetics contribute to subgrade stabilization is to quickly and efficiently dissipate pore pressures developed in the subgrade soil during dynamic loading as shown in Figure 2 (Christopher, et. al. 2009).
The loading and data collection software were set up to provide a linear load increase from zero to 40 kN (9 kip) over a 0.3 second rise time, followed by a 0.2 second period where the load is held constant, followed by a load decrease to zero over a 0.3 second period and finally followed by a 0.5 second period of zero load before the load cycle is repeated, resulting in a load pulse frequency of 0.67 Hz. The maximum applied load of 40 kN (9 kip) resulted in a pavement pressure of 552 kPa (80 psi). The load frequency is selected to allow the data acquisition system time to store data before the next load pulse was applied.
Large-scale lab testing of the RSi prototype high strength woven geotextile showed early reductions in surface rutting behavior in large-scale testing compared to HP-Series high strength woven and X-Series slit tape woven geotextiles.
The RSI prototype geotextile also provided better pore pressure dissipation during dynamic load testing and higher pullout resistance in common roadway geotechnical fills than previous woven geotextiles.
Full-Scale Geosynthetic Testing
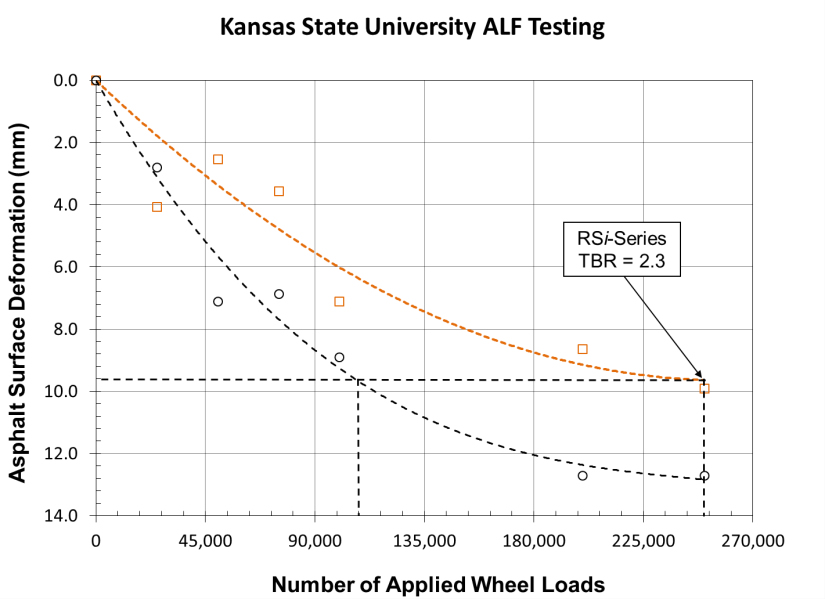
Full-scale testing has been performed by Kansas State University (KSU) to better determine the stabilization benefits of GTXw. The accelerated load frame (ALF) sections were created to evaluate traffic benefit ratios (TBR) and aggregate base course and asphalt reductions using GTXw. The reaction frame of the ALF machine covers a distance of 12.8 m (42 ft). The wheel loading assembly is belt driven by a 20-HP electric motor and controlled by hydraulic pressure. The loading mechanism can control hydraulic pressure, tire pressure, and test speed. In this test, an 80-kN single axle load with air-bag suspension was applied on dual tires with tire pressure of 620 kPa and testing speed of 11.3 km/h. A ±150 mm lateral wander was applied in a truncated normal distribution with 676 repetitions for one wander cycle in order to model traffic patterns. Rut measurements were recorded after every 50,000 wheel passes. Once the rut depth measurement reached 12.5 mm (0.5 in), the test section was considered to have met the failure criterion. Graphs were generated to show the actual rut depth recorded at each 50,000 pass interval. The number of truck passes corresponding to a rut depth of 12.5 mm (0.5 in) was estimated from the data plot.
ALF testing results show that GTXw provide a significant increase in the structural stability of cross sections. GTXw provide support for over twice the number of wheel loads applied to the unreinforced sections as shown in Figure 3.
WELL PAD CONSTRUCTION AND GEOSYNTHETIC INSTALLATION
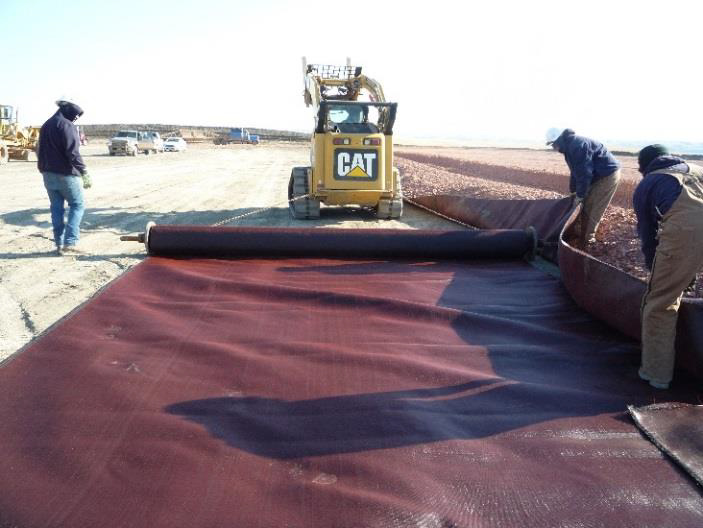
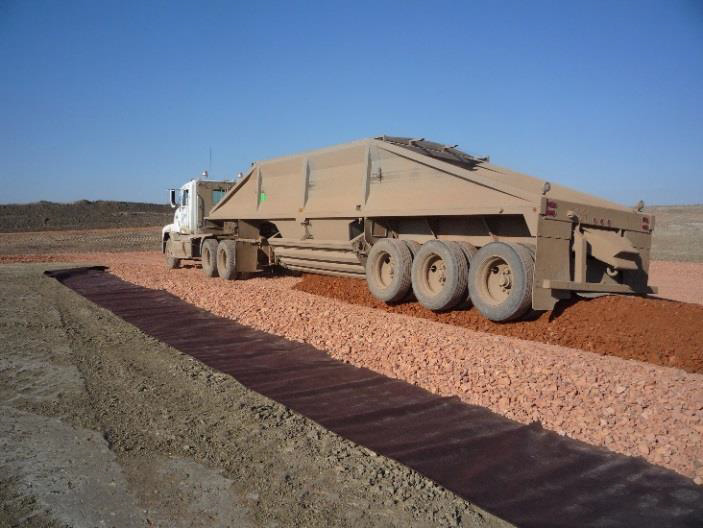
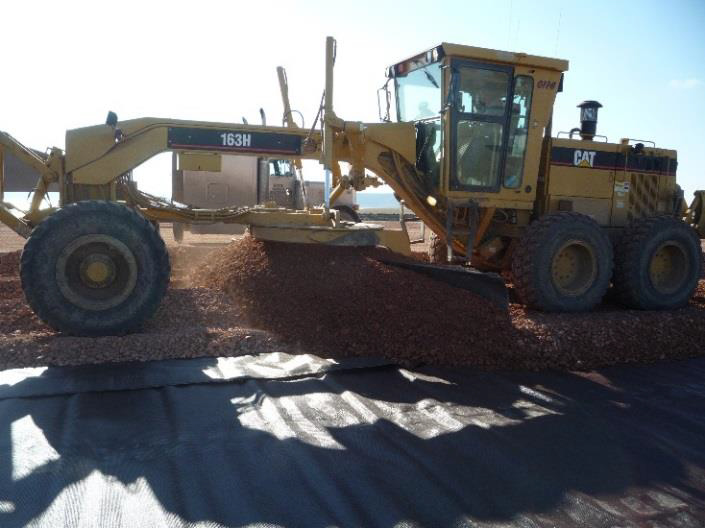
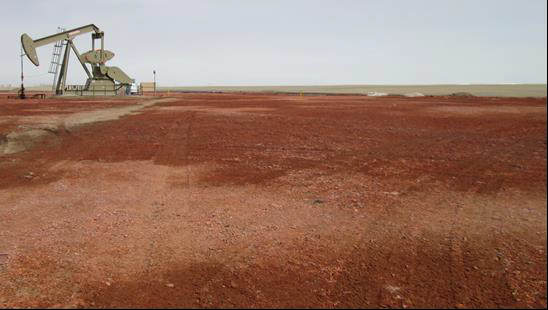
Typical conditions where the geotextile is utilized includes saturated soils and subgrade soils with a CBR less than 3.0% (Figure 4). The geotextile is placed directly on the subgrade. Adjacent rolls are overlapped 600 mm (24 in) (Figure 5). 100 mm (4 in) minus scoria aggregate is placed directly on the geotextile in a 150 mm (6 in) lift. Rubber tired trucks can be driven over the geosynthetic to speed placement of the aggregate (Figure 6). Graders spread the aggregate evenly over the geotextile (Figure 7). No compaction methods are employed prior to the well pad receiving drilling equipment.
GEOSYNTHETIC IN-PLACE PERFORMANCE
To date, over 1,254,191 m2 (1,500,000 yd2) of GTXw have been installed on Whiting well pads and access roads. The geosynthetic has proven extremely durable and resilient to the challenging conditions of the Williston Basin. In addition to the long-term cost and environmental benefits, additional benefits include quicker well pad construction time versus thicker aggregate sections or chemical stabilization.
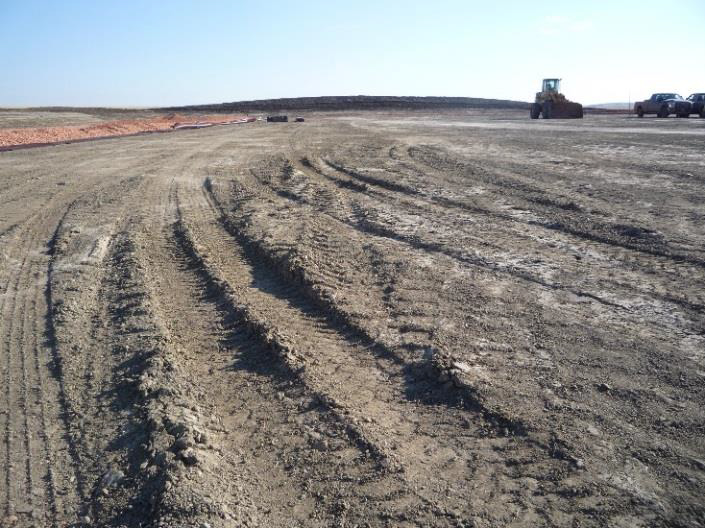
Figure 8 below shows a well pad constructed in November 2011. The photograph is from April 2013. This well pad was constructed with the traditional 100 mm (4 in) aggregate placed directly on the subgrade. Severe rutting has left this well pad in need of maintenance. An additional 225 mm (9 in) of aggregate will be added to re-stabilize the well pad.

Figure 9 below shows a well pad constructed in November 2011 utilizing GTXw. The photograph was taken in April 2013. The edge of this well pad is located approximately 30 m (100 ft) from the edge of the well pad in (Figure 9).
Similar subgrade conditions were present at both locations and both locations received similar construction, drilling and hydraulic fracturing wheel loads. Performance of the geosynthetic stabilized well pad has been excellent.
GEOSYNTHETIC COST AND ENVIRONMENTAL BENEFIT
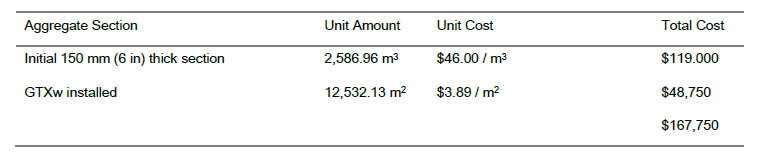
Aggregate savings per well pad has averaged $76,550. This results in a 31.3% cost savings per well pad. The GTXw stabilization method has been utilized on approximately 30 well pads annually, with an annual savings of $2,296,500.
NOTES FOR TABLES 3 & 4
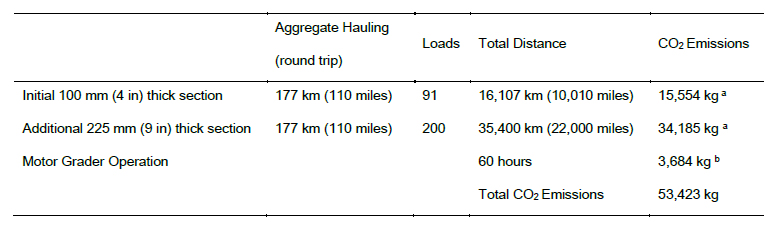
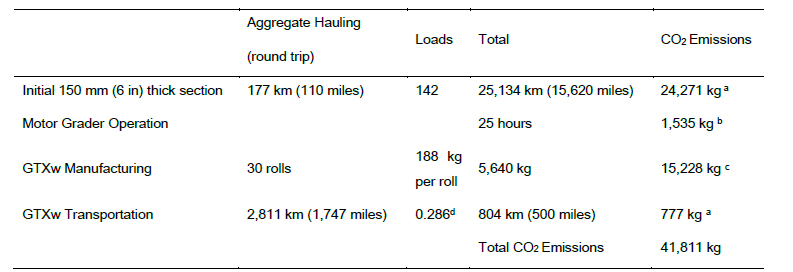
a Material hauling calculated at a truck fuel consumption rate of 6.5 miles per gallon. CO2 emissions calculated at a rate of 10.1 kg of CO2 produced per gallon of fuel used.
b Motor grader operates at 190 HP with a fuel consumption rate of 0.032 gallons/hour/horsepower. CO2 emissions calculated at a rate of 10.1 kg of CO2 produced per gallon of fuel used.
c Geosynthetic manufacturing carbon footprint calculated at 2.7 kg of CO2 per kg of material (Koerner 2013).
d 3.5 well pads worth of geosynthetic can be transported on one truck from the geosynthetic manufacturing facility to a storage yard near the well pad locations. Therefore, overall shipping distance is divided by 3.5 to calculate the CO2 emissions produced by transporting the geosynthetic required for one well pad.
The carbon footprint associated with an individual well pad utilizing the geosynthetic stabilization method is reduced by 11,612 kg of CO2 versus conventional aggregate maintenance. This results in a CO2 emissions reduction of 21.7% per well pad. The geosynthetic stabilization method has been utilized on approximately 30 well pads annually, resulting in an annual carbon footprint reduction of 348,360 kg of CO2.
CONCLUSIONS
The incorporation of high strength geosynthetics into the initial construction of well pads and access roads have led to multiple benefits. Annual stabilization maintenance with the addition of aggregate to fill in wheel ruts has been eliminated. This has resulted in per well construction savings of 31.3%. Environmental impact has been reduced. The carbon footprint on each well pad utilizing the geosynthetic stabilization method has been reduced by 21.7%. Additional benefits include the elimination of costly time delays. Well pads in the past constructed over soft, saturated subgrades without a geosynthetic could experience delays on average of 2 to 5 days. When a well pad had deteriorated to the point that additional aggregate was required to stabilize a site, drill rig and/or hydraulic fracturing mobilization had to be delayed. Whiting estimates a financial burden of $100,000 every day a well pad could not be accessible. Reduced construction costs on well pads ultimately is reflected in reduced market prices for gasoline, heating oil, natural gas, plastics, cosmetics and all fossil fuel based products consumers purchase on a daily basis.
ABOUT THE AUTHORS
John Herrmann works for TenCate Geosynthetics America. Bruce Lacina, P.E., worked for TenCate Geosynthetics Americas. He passed away in October 2019. Monte Madsen worked for Whiting Petroleum Corporation at the time of this paper’s publication.
A version of this article was published in the GeoAmericas 2016 proceedings.
REFERENCES
Barenberg, E. J., 1975. “Evaluation of Soil Fabric-Aggregate Systems with Mirafi® 500X.” Civil Engineering Studies.
Christopher, B.R. and Lacina, B., 2008. “Roadway Subgrade Stabilization Study.” Proceedings of GeoAmericas 2008, pp. 1013 – 1021.
Christopher, B.R., Perkins, S.W., Lacina, B.A. and Marr, W.A., 2009. “Pore water pressure influence on geosynthetic stabilized subgrade performance.” Proceedings of Geosynthetics 2009 (pp. 25 – 27).
Giroud, J.P. and Han, J., 2012. “The Giroud-Han design method for geosynthetic-reinforced unpaved roads.” Geosynthetics. Vol. 30, No. 1, pp. 40 – 49.
Giroud, J. P. and Noiray, L., 1981. “Geotextile reinforced unpaved road design.” Journal of the Geotechnical Engineering Division, 107(GT9): 1233 – 1254.
Heukelom, W. and G. Klomp, A. J., 1962. “Dynamic testing as a means of controlling pavements during and after construction.” Proceeding of International Conference on the Structural Design of Asphalt Pavements.
Koerner, R.M., 2013. “Carbon Footprint of Geosynthetics.”Geosynthetics, October/November 2013, pg. 16.
Saghebfar, M., 2013. “Investigation of Bearing Capacity of Geotextile-Reinforced Paved Roads.” Mid-Continent Transportation Research Symposium.
Steward, J. E., 1977. Guidelines for use of fabrics in construction of low volume roads, FHWA-TS-78-205. Department of Agriculture, Forest Service.


